Effective Tax Rates in Ireland
Government spending, such as spending on health, education, defence and infrastructure, takes up a large share of European economies’ national income. To finance their expenditures governments need to raise revenues from various types of taxes, e.g. personal and corporate income taxes and taxes on profits, among others. The type of taxes on which each government chooses to rely on with respect to others, the so-called tax policy mix, affects the economic incentives to work and invest and, ultimately, each country’s economic performance.
Due to the significant differences in the national tax systems, for example the different statutory rates for the same product categories, tax credit policies and deduction schemes, a simple comparison of the tax policy mix among EU countries is not informative and might be misleading.
As such, it is necessary to construct tax measures that can provide a good approximation of the total tax burden imposed and be comparable with the rest of EU countries.
In this article we focus on a set of aggregate tax indicators known as effective tax rates (henceforth ETRs). The ETRs are indicators calculated based on the actual revenues received by the tax authorities and National Accounts data published by Eurostat. In particular, the ETRs are calculated as the ratio of the tax revenues received by the various tax headings divided by an approximation of the corresponding tax base constructed using National Accounts data.
The main advantage of these indicators is that they measure the net effect of the various existing rules of each country’s tax system after taking into account all the relevant deductions, exemptions and credits. Thus, they are ideally suited for international comparisons as well as for informing policymakers about the actual tax burden levied on each part of economic activity.
In a recent publication,1 we compute the ETRs for the Irish economy over the period 1995–2017 and compare them with the EU average2 in order to examine the extent to which the structure of the tax system has contributed to the macroeconomic performance of Ireland. In particular, we focus on the following key tax indicators: consumption, labour and capital income, social security contributions and corporate income. The main results of the analysis are summarized in Figure 1, which depicts the average of the tax indicators for Ireland and the EU over two periods: 1995 up to 2017 and 2012 up to 2017, respectively.
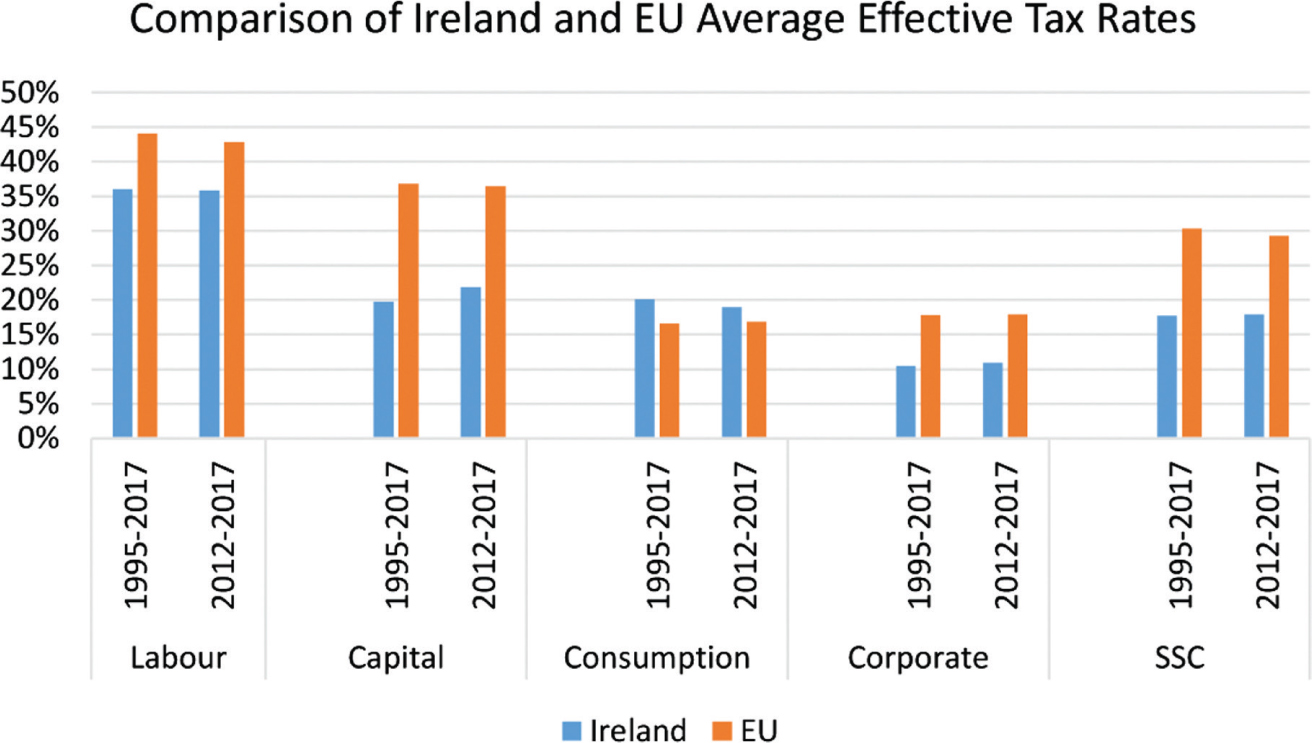
As can be gleaned from the graph, the tax burden on labour and capital income is lower in Ireland by 8 percentage points and 18 percentage points between 1995 and 2017 on average, respectively, with the gap widening when we focus on the post Global Financial Crisis period. Similarly, the ETR on corporate income is lower by 7 percentage points for the 1995–2017 period and almost 10 percentage points between 2012 and 2017. At the same time, Ireland’s consumption ETR is on average almost 4 percentage points higher than the EU average, although for the 2012–2017 period the difference is reduced. Finally, Social Security Contributions (SSC), one of the main indicators of the non-wage cost and an important factor determining international competitiveness, is significantly lower in Ireland compared to the EU average.
Overall, Ireland’s tax policy mix seems to incentivize businesses and labour relatively more when compared to the EU average. Relatively low distortionary taxes (i.e. taxes on labour, capital and corporate income) are theorized to be conducive to strong economic performance as they enhance the prospects of sustainable growth and create a business environment that attracts FDI and high skilled workers.
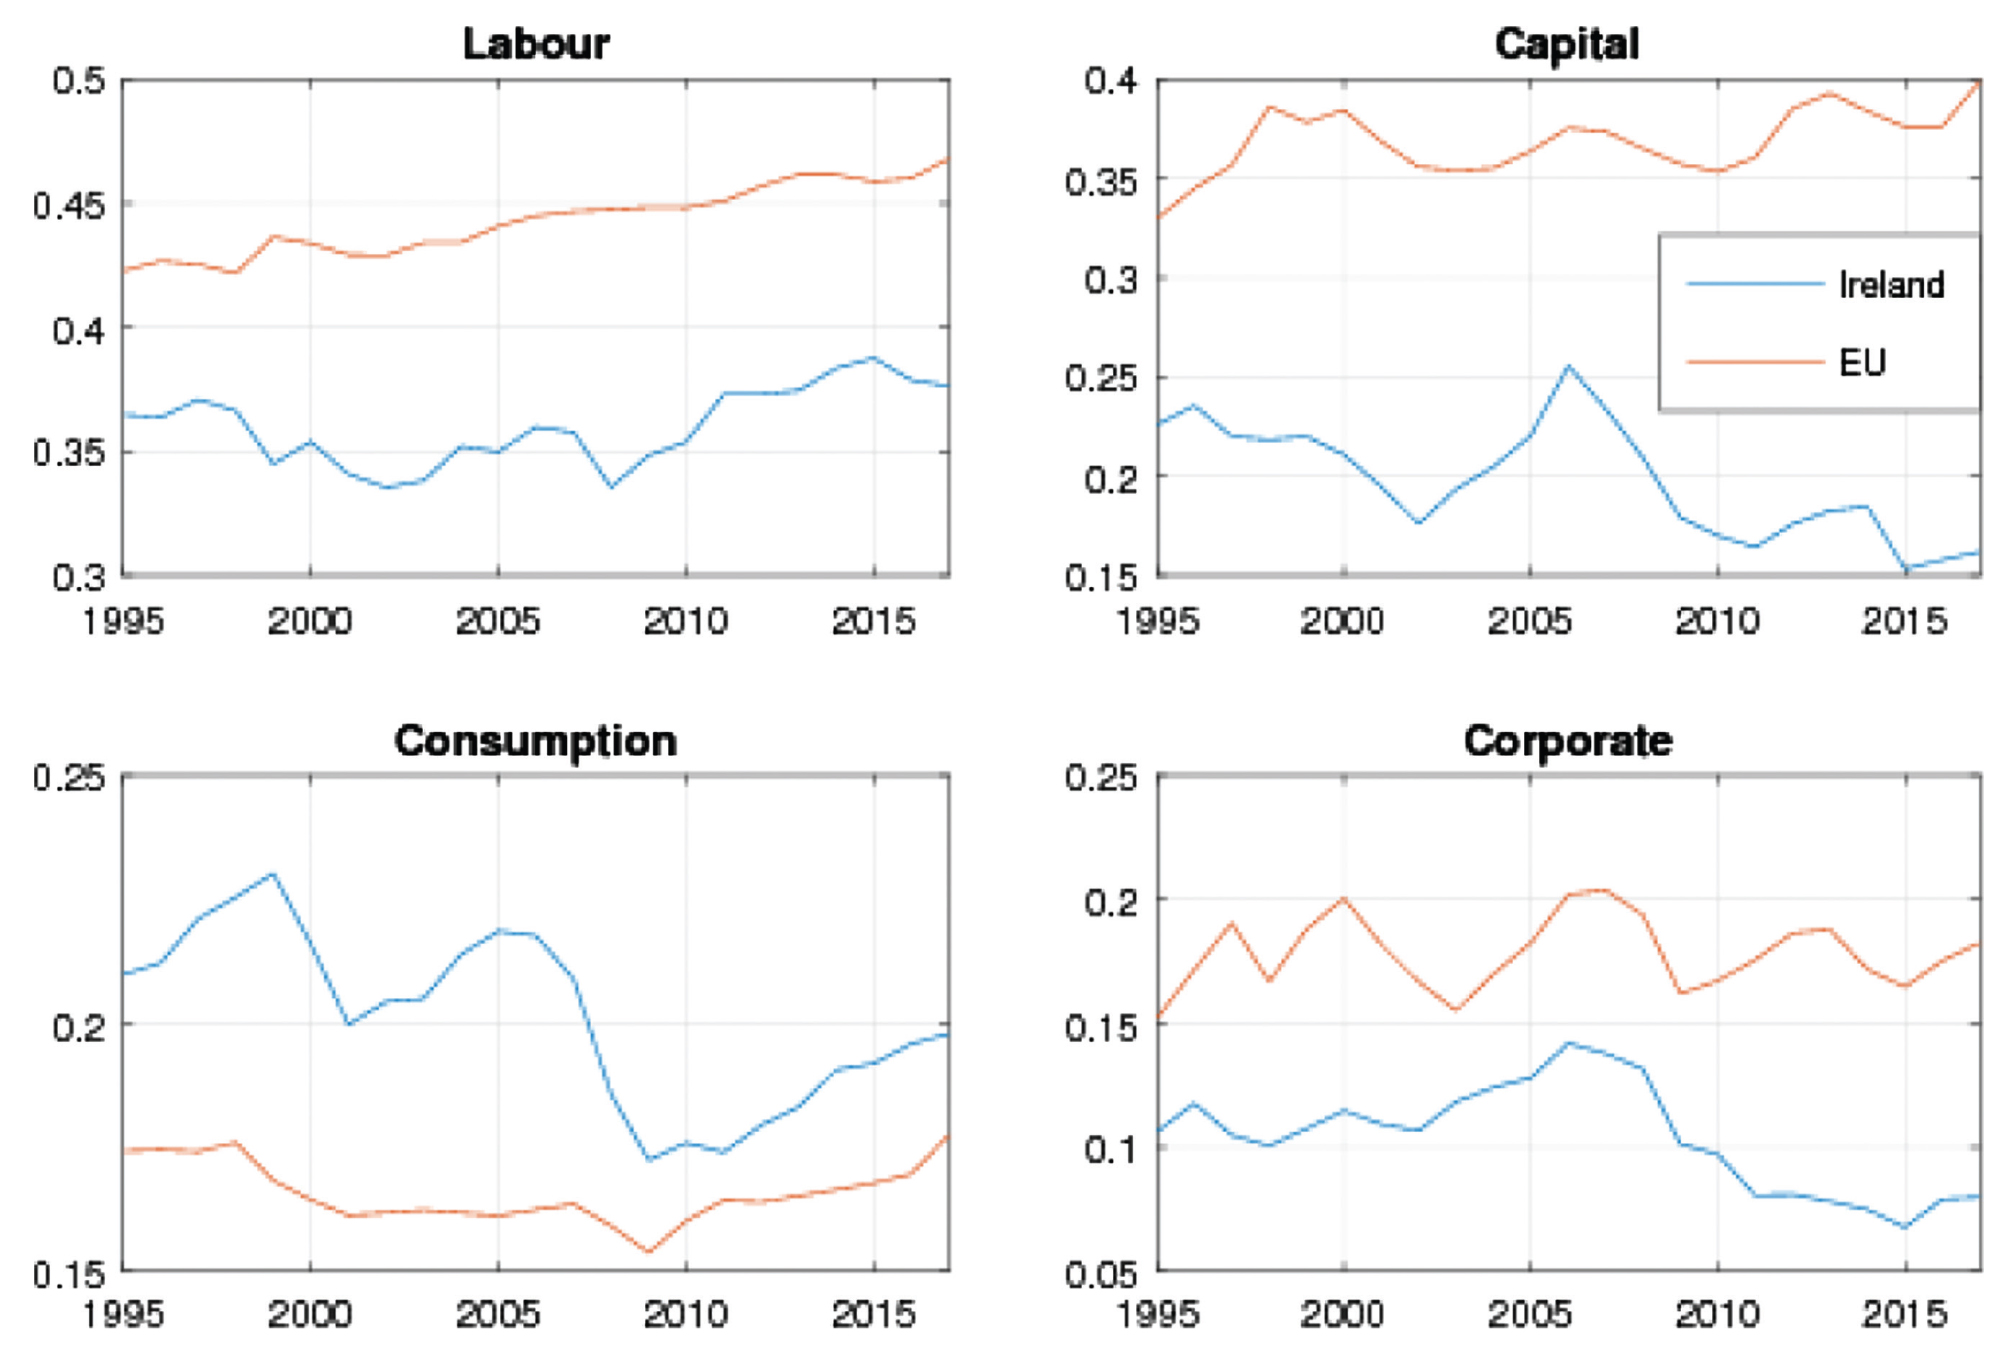
In order to obtain a better insight into the evolution of the ETRs over time, we turn to the analysis of the results presented in Figure 2. It is evident that the more distortionary ETRs are significantly and consistently lower in Ireland than the EU average. The only aggregate tax indicator that is consistently higher in Ireland is the tax on consumption. However, in the post-crisis period the Irish ETR on consumption largely converged to the EU average, with their difference now being 2 percentage points on average, lower compared to the 4 percentage points pre-crisis difference. All the Irish ETRs dropped at the start of the Irish crisis in 2008 mostly due to the large fall in the associated tax revenues. Following this drop, the Irish labour and consumption taxes have recovered and follow the upward trend of the EU average. The taxes on capital and corporate income, on the other hand, followed a downward path in the post-crisis period, which can to a large extent be attributed to the well-known distortions in the Irish National Accounts caused by the operations of a small number of multinational firms, which constitute the bulk of the corresponding tax base (we provide a detailed analysis of this subject in our report).
Figure 2: Main Effective Tax Rates, Ireland vs EU 1995–2017
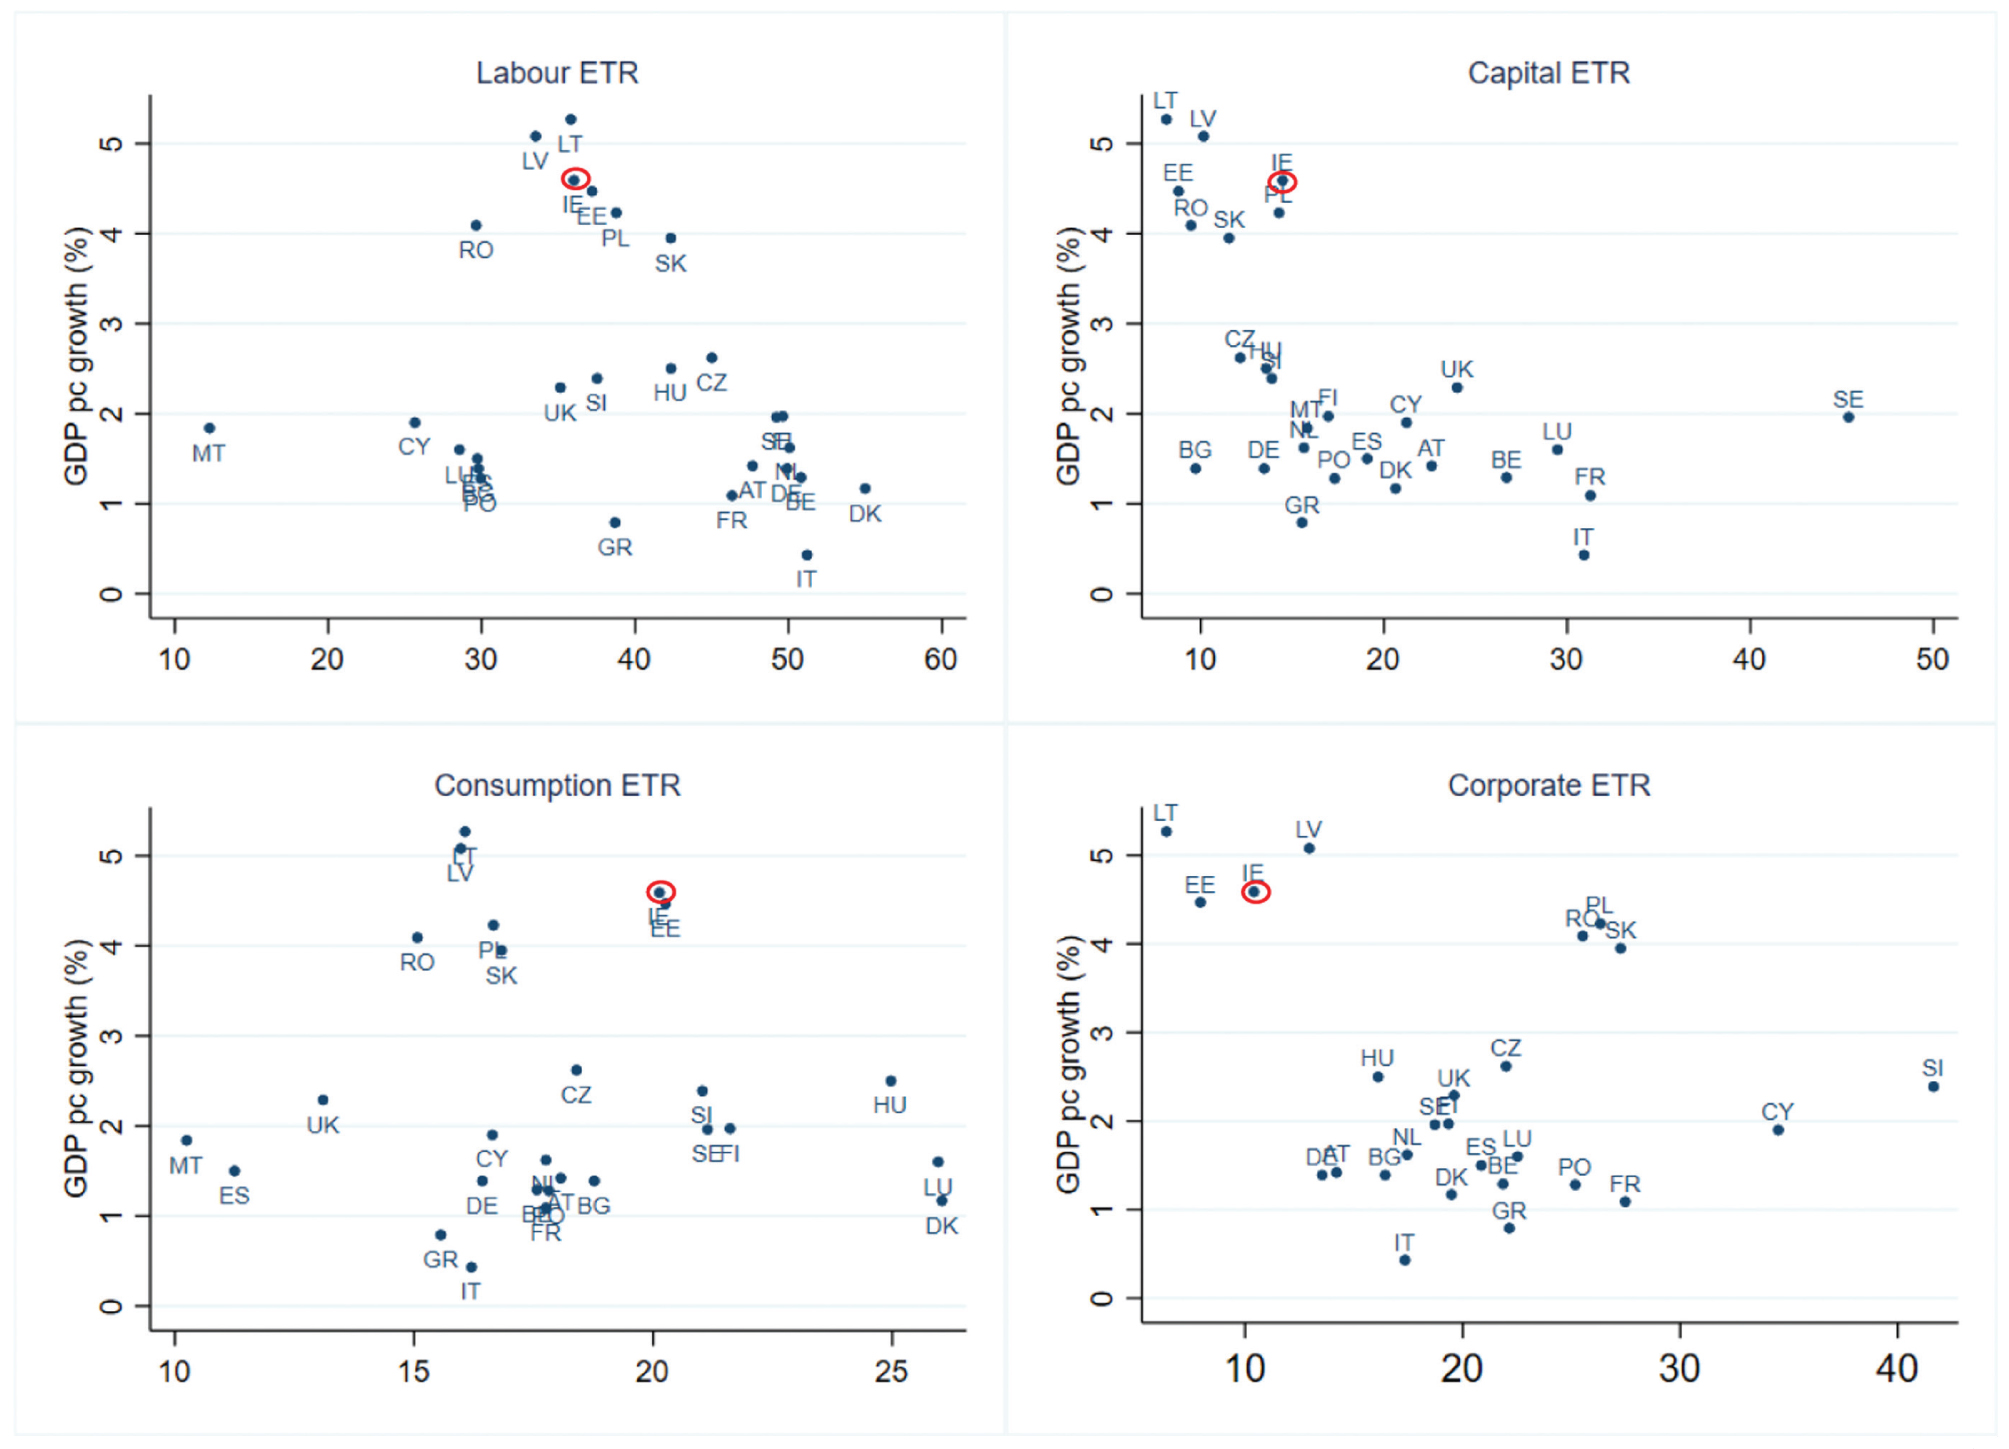
Turning to the correlation between the effective tax rates and the rate of growth of GDP, Figure 3 shows that the more distortive taxes, i.e. labour, capital and corporate income taxes, seem to have a negative relation with GDP, as expected from economic theory. For example, in the top left panel we observe that Ireland, with an average labour ETR of 37 percent exhibits an average rate of GDP growth of almost 4.5 percent, while countries such as Denmark, Netherlands and Italy with labour ETRs around or higher than 50 percent exhibit significantly smaller average GDP growth rates. It should be noted here, however, that this is a simple correlation – it should not be interpreted as representing a causal relationship, that is we cannot conclusively state that the tax rates are the only determinant causing the observed outcomes in GDP growth. This would require a more formal econometric approach, which goes beyond the scope of the present article.
Our analysis illustrates significant differences between the Irish tax structure and that of the EU countries. In Ireland, taxes that are likely to have distortionary effects on economic activity, such as those on labour income, are almost eight percentage points lower than the EU average. In contrast, the tax burden related to less distortionary taxes, such as consumption, is higher by three percentage points over the 1995–2017 period. Relating these estimates to indicators of economic activity (for more details we refer the interested reader to section 5 of the ESRI report linked above), the research finds that higher labour taxes are associated with fewer hours worked, while capital and corporate taxes are negatively related with business investment. Overall, our descriptive analysis indicates that the tax policy mix followed by Ireland could be a contributing factor to the country’s strong economic performance.3
Figure 3: GDP Growth and ETRs
Authors
Ilias Kostarakos: Postdoctoral Research Fellow, ESRI (ilias.kostarakos@esri.ie)
Petros Varthalitis: Research Officer, ESRI (petros.varthalitis@esri.ie)
1 Link to the relevant ESRI report: https://www.esri.ie/publications/effective-tax-rates-in-ireland.
2 For the purposes of this article, the EU average refers to the simple arithmetic mean of the effective tax rates of the EU countries.
3 Given the descriptive nature of the analysis and the fact that we do not consider changes in expenditures a conclusive analysis on the effects of the fiscal policy mix cannot be conducted in this context, as it requires empirical and/or structural analysis. We refer to Kostarakos and Varthalitis (2020) “Fiscal policy and growth in a panel of EU countries over 1995–2017” for the effects of the fiscal policy mix on growth and on Varthalitis (2019) “Fiscal multipliers in Ireland using FIRGEM model” for a structural analysis that includes both taxes and spending.